November, 2024
We’re thrilled to introduce Dawiso 2024.9+10! 🚀 This release is packed with new features and enhancements designed to streamline your workflows and unlock even more productivity.
Take a look at the latest features and see how they can make a difference in your day-to-day tasks!
New Features
New Dashboard Charts and Graphs
New charting capabilities in Dawiso open up greater customization options for your dashboard visualizations. You can now tailor your data insights to best support your workflow and decision-making thanks to:
-
Flexible date selections with a global time selector that applies a consistent date range across the entire dashboard.
- The time selector will also apply to any wordclouds or other number indicators on the page. Wordclouds previously had their own independent time selectors.
-
A wider variety of graph types with two main customization levels:
- Data configuration: Select data types via API statistics tables or our database API.
- Graph definition: Beyond previous column, pie, and line charts, you can now configure charts using the all the possibilities that Chart.js offers. This unlocks a range of graph possibilities including area line charts, radar charts with flexible colors, shapes, and many more.
-
Multi-dataset comparisons as it’s now possible to add multiple datasets in one graph for comparative insights (e.g., viewers and contributors over months).
-
Optimized performance as these charts will now use procedures rather than API tables, improving overall performance.
Summaries Cards with Statistics
Your dashboards can be enhanced with our newly redesigned summaries cards. These cards allow you to display key metrics, such as the number of business domains, most visited apps, or active users. Additionally, they support percentage comparisons with the previous period, providing better insights and a clearer overview.
Knowledge Graph
We’re happy to introduce the addition of knowledge graphs, which support advanced object mapping. You will be able to view complex relations between objects, roles, and spaces in a new format.
Knowledge graphs serve as a replacement for the previous relations diagrams and offer more precise navigation by utilizing filter views by asset types and spaces.
New Scanners
- SAP HANA: Now fully supported.
- Confluent Kafka: Coming soon!
Enhancements and Optimizations
Attachments
Permission to make changes to attachments can now be linked directly to the workflow state, regardless of the user’s permission to edit the object. For example, unless the object is in the Edit state, no user (except for admins and space admins) can add or remove any attachments.
Data Lineages
We continuously work on optimizing our data lineages, one of our most important features. As such, the following has been improved:
- Path simplification: A Show all paths toggle has been added to allow a clearer view focused on the selected object and its object paths. Previously, all paths for all shown objects were automatically displayed, leading to an overly complex diagram.
- Undo feature: Manually added elements can be reversed with a simple
ctrl+zcommand.
Default User Role Assignment to Creator
Your app can be configured to automatically assign a user role (e.g. data owner) to the user who creates the object.
Object Numbering
Admins and space admins can enable or disable default numbering for objects within an application.
Object Type Pages
If your object has an external link as an attribute, the link can be now added as an action button to the object header.
The button will also appear in object detail previews when using the advanced search.
Platform Configuration Page
A convenient new button to sync marketplace packages was added to the Configuration page. The Start sync button ensures that you always have access to the latest applications.
Text Editor
Customized HTML-rich default text can be preconfigured for text fields. The HTML-rich text will then automatically populate the fields when editing text editors—this can be ideal for example for templates.
UX/UI Improvements
To enhance your user experience, the following UX and UI improvements have been introduced:
-
API tables: Column widths now adjust dynamically to fit the content, with longer text displaying up to a defined maximum, ensuring readability without exceeding set width limits.
-
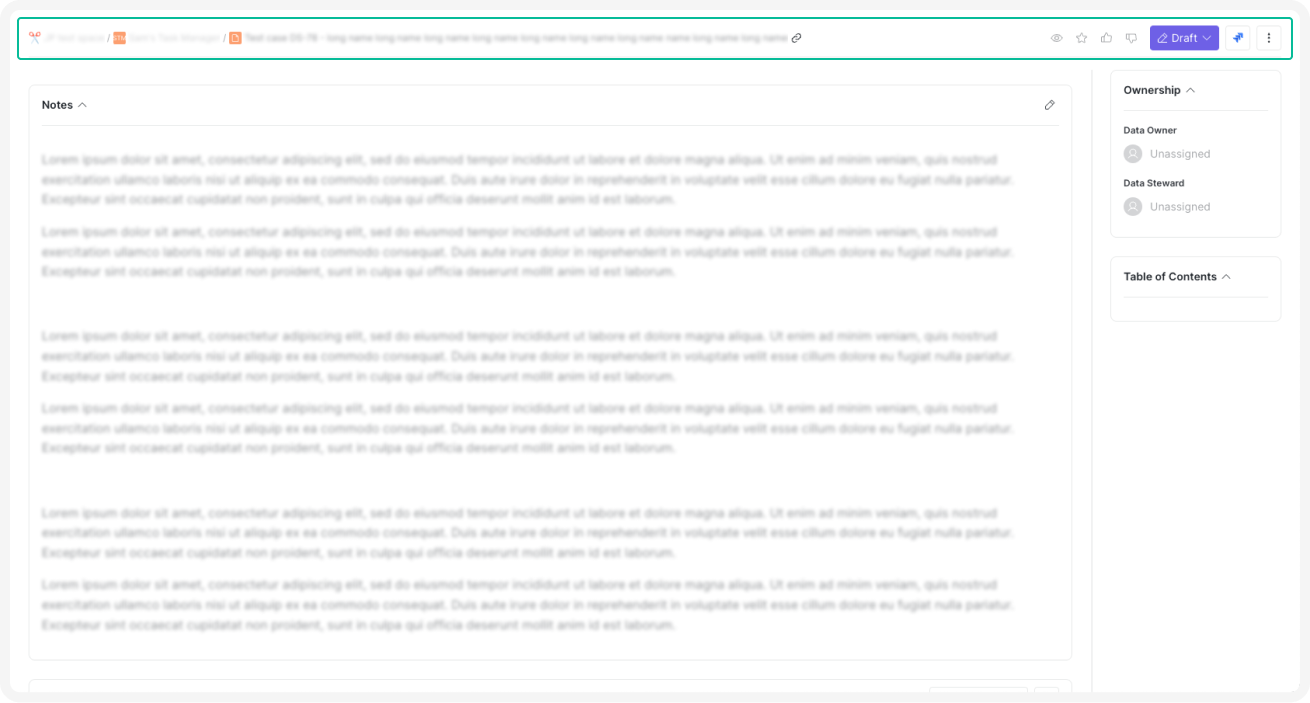
Optimized scrolling on object pages: A compact header stays pinned, showing essential actions and information such as workflow state, favorite actions, and Jira tickets.
-
Favorites page and other table views: Display options like card and table view are available, and selected settings will be retained for future sessions.
-
Homepage tab management: When only one tab is present on the homepage, it will be hidden for a cleaner view.
-
Search enhancements: Object search in text editors and diagrams now displays full object names and paths for improved reference.
-
Workflow diagram: Zoom and scroll support is now available in workflow diagrams, enhancing navigation and providing a clearer view.