Data lineage diagrams allow understanding the flow of data through an organization.
In Dawiso, the data lineages component can be added to any object type via packages configuration. By default, data lineages are a part of all metadata apps.
Lineage views
In Dawiso, lineages can be viewed in two ways:
- On the object page: On the object page, the lineage view is available as a part of the Diagrams section of an object template. Select Data lineage option using the drop-down menu.
- In fullscreen view: In the top-right corner of your diagram, click the
 button for the fullscreen view to open in the same tab.
Lineage diagram icons
Data type
When a column is assigned a specific data type, an icon representing that type is displayed in the lineage diagram. If no data type is assigned, the default object type icon is shown instead. Below is an overview of the icons and the data types they represent:
Components
Each lineage diagram consists of the core elements:
| Component | Use |
|---|---|
 Folders Folders | Folders are the highest-level objects that can be visualized in a Dawiso lineage diagram. They are used for databases, schemas, or other high level structures from metadata apps. Folders are marked by (e.g., Folder_name). |
 Objects Objects | Objects are the main component of Dawiso lineage diagrams. At this level, you can find tables, reports, etc. Objects are marked by (e.g., Object_name). |
 Columns Columns | By default, the column level is hidden under the object level. It can be revealed by clicking the down arrow symbol next to the object-level component. Apart from table and view columns, reporting attributes can also be found at this level. Columns are marked by (e.g., Column_name) |
| — Flows | Flows visualize the actual flow of data through the organization. In Dawiso data lineages, they appear as black lines between components. There can be multiple levels of flows depending on the desired level of detail. For more information, see Flow levels. |
 Scripts Scripts | Flows marked with the script icon signify that a flow is described by a function, procedure, or another object in Dawiso. Click the icon for more details, or select a script in case of multiple. 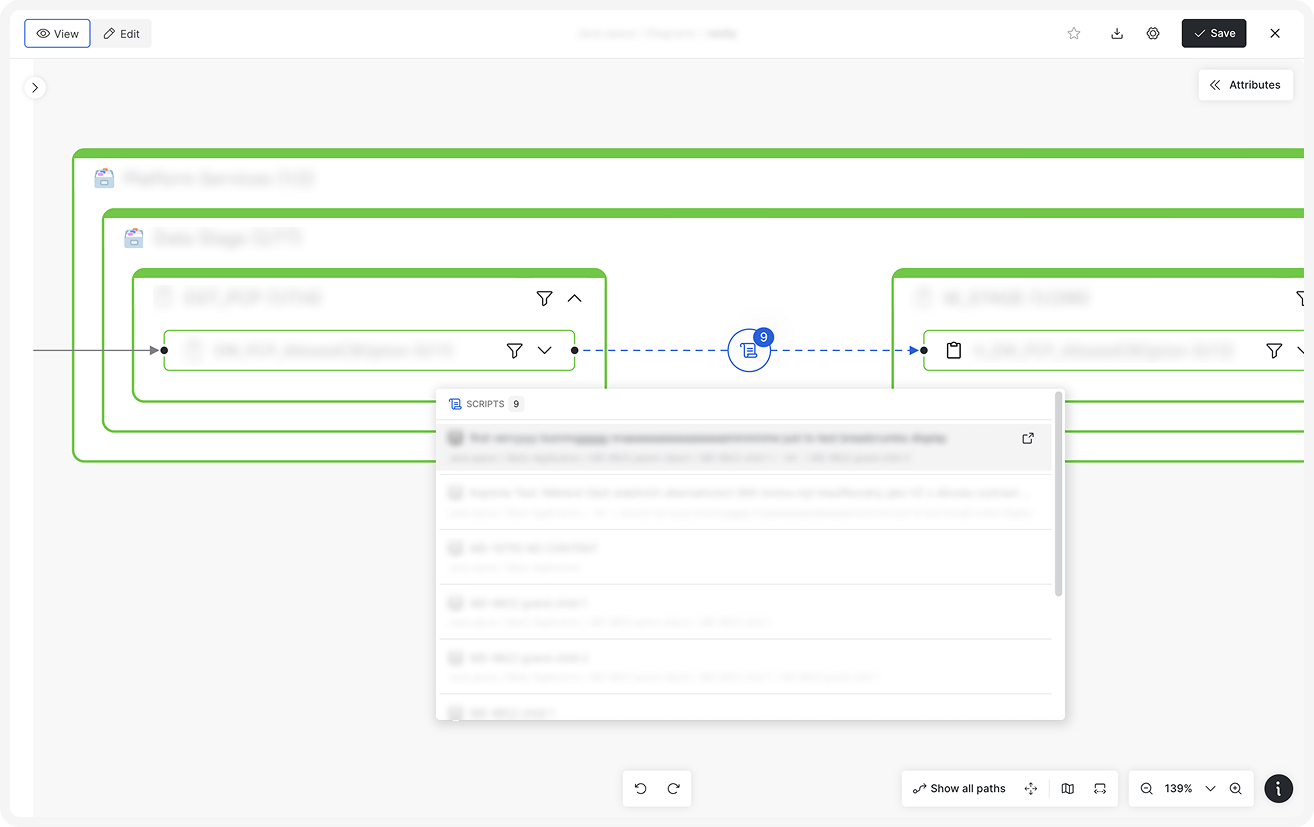 |
Flow levels
Flow levels define the granularity at which data movement is visualized in the lineage diagram. Each level provides a different depth of detail.
- System-level flows connect folder components and visualize high-level data flows. They are used for a quick overview of connections between different databases or systems.
- Table-level flows visualize the connection between tables, reports, and other components. They are the most common level of data lineage visualization.
- Column-level flows visualize flow of data between columns or attributes. They are the most detailed level that Dawiso can display and are used for deep flow analysis and impact studies.